
This page walks through the process i’ve taken to deploy Nexus Dashboard 4.3(1) The overall intention here is to link Nexus Dashboard with Intersight and then extend this into Cloud Control.
Key Points
- Single Node
- Layer-2 Deployment Type
- Virtual Deployment using OVA
- Thin Provisioned Storage
- Two networks connected, one for management, one for fabric
- Data Appliance (Includes Fabric Management and Telemtry)
- Must have internet access on management for Intersight
Initial VM Installation
The OVA is found within the Software Downloads within Cisco.com. If we’re upgrading an existing Nexus Dashboard we should be using the ISO file, however my installation is greenfield.
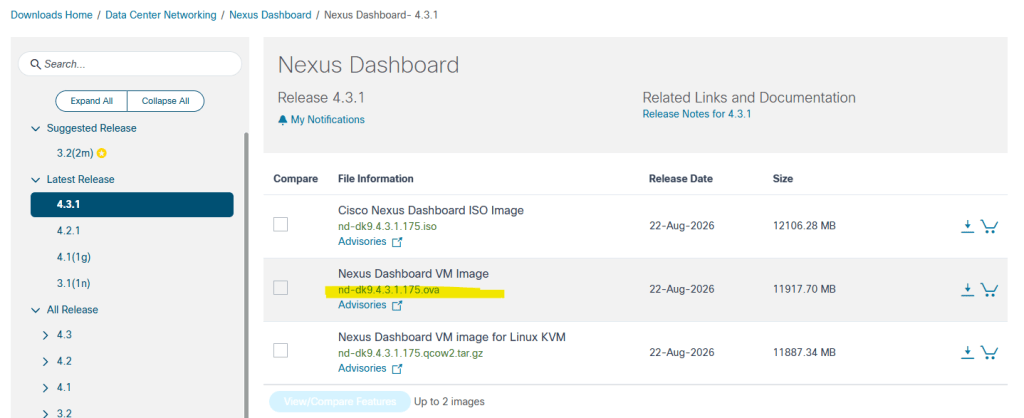
Interestingly 3.2.(2m) is still the suggested release as I was informed 4.3.1 would become the suggested. I believe 4.3.1 is the first version of Nexus Dashboard to become available for integration into Cloud Control
Next we can deploy the OVA. In vSphere we can right click deploy OVF and select our local file. Next we can select a name for the virtual machine, select our compute resource.
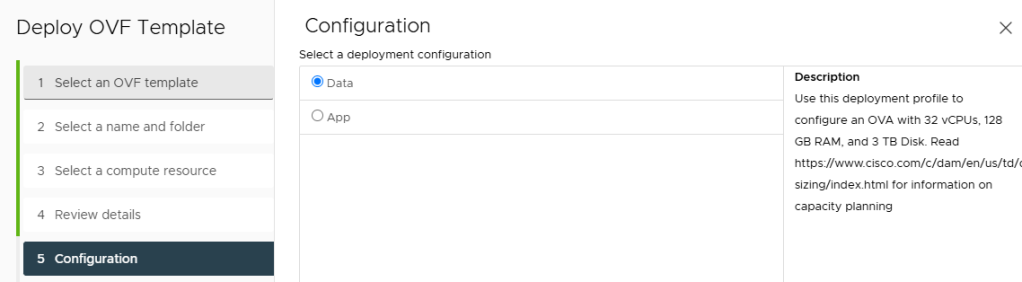
The main decision points are shown below.
Data or App
- Data = Fabric Management AND Monitoring (Telemetry)
- App = Fabric Management OR Monitoring (Telemetry)
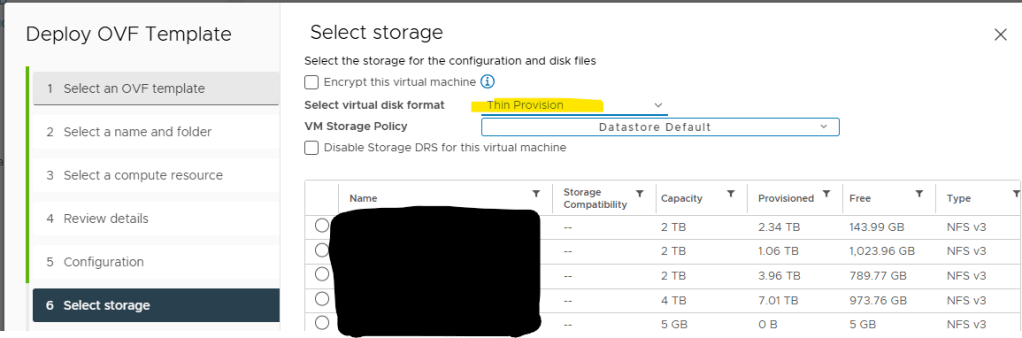
Next we select our storage. It’s preffered due to the storage requirements on these nodes to run Thin Provisioned. I’m yet to find or witness a downside to this however the Cisco recommended option is Thick Provisioning Lazy Zeroed as per the deployment guide.
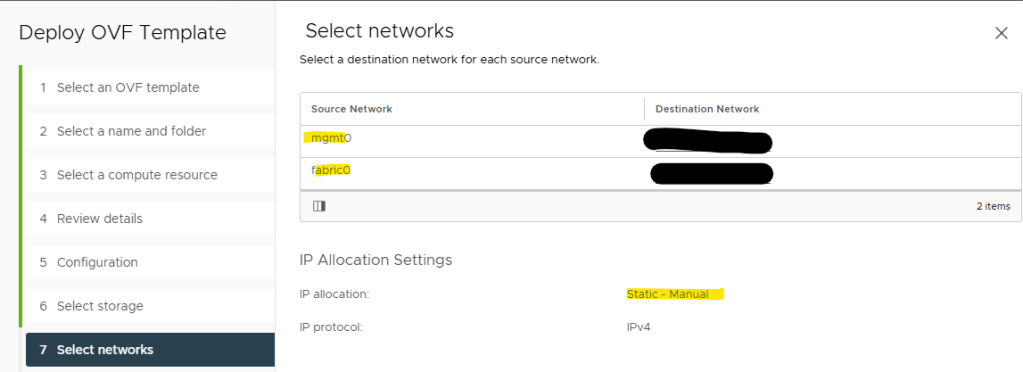
Next we configure out networks. One for management and one for fabric. This is a key decision point especially if we’re connected our dashboard to the environment it’s managing (This is a bad idea). We should always have a dedicated out of band network to manage our switches and to connect to from the management interface of our nexus dashboard. This line often becomes blurred when we’re deploying virtually and without physical UCS.
For me the key differentiation when making this decision is management will allow me to connect to dashboard UI and allow dashboard to reach Intersight. Fabric will monitoring and provide telemetry to our switch fabrics… The grey area is pushing configuration from dashboard to our switch management interfaces. This can be either fabric or management which is confusing. Physical UCS I use OOB management. Virtual deployments we often use the fabric port to manage the switch fabrics. (Worth mentioning you can change the interface you manage your switch fabrics from).
So below i am selecting two different networks, one for my mgmt0 interface and the other for fabric0. IP allocation can be DHCP but for me i’m using manual IPs. the IP allocation here is referencing mgmt0 and this configuration is how you will access the Dashboard UI.
Next we can set our manual IP address, again remembering this is our mgmt0 interface. (The fabric0 will come later within the dashboard UI deployment guide).
Another key point to mention is the rescue-user password. This will be the password you’re asked for when dashboard is booted for the first time and how you access the CLI. Don’t forget it.
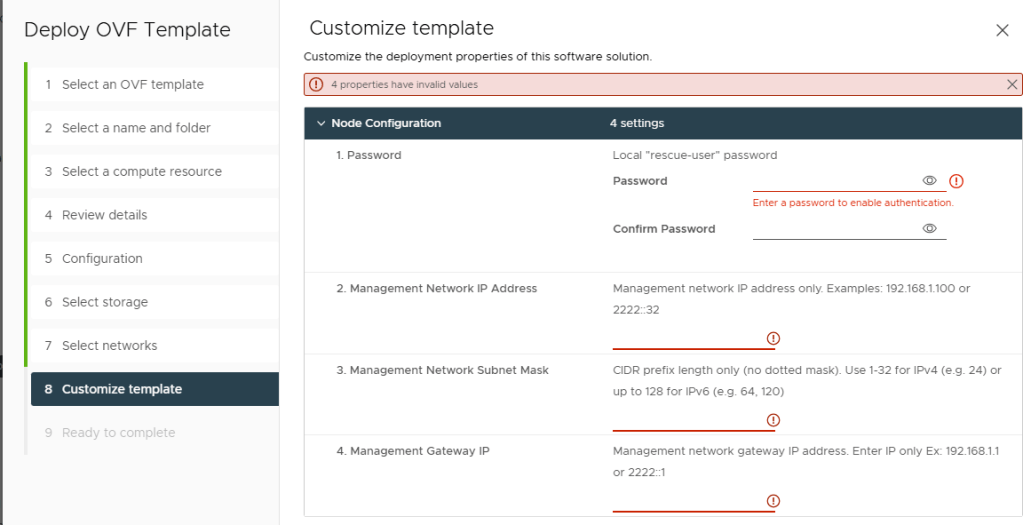
Now we can move to complete and let the VM deploy. Once it’s deployed then power on. Once powered on you should be able to ping the management IP you configured (Depending on how the network between your dashboard management range and laptop is configured).
For me this is a VPN to our environment and the management gateway IP is on a firewall. So nice and straight forward. I have confirmed I can now access my Dashboard.
Initial Nexus Dashboard Deployment
So lets ‘Meet Nexus Dashboard’
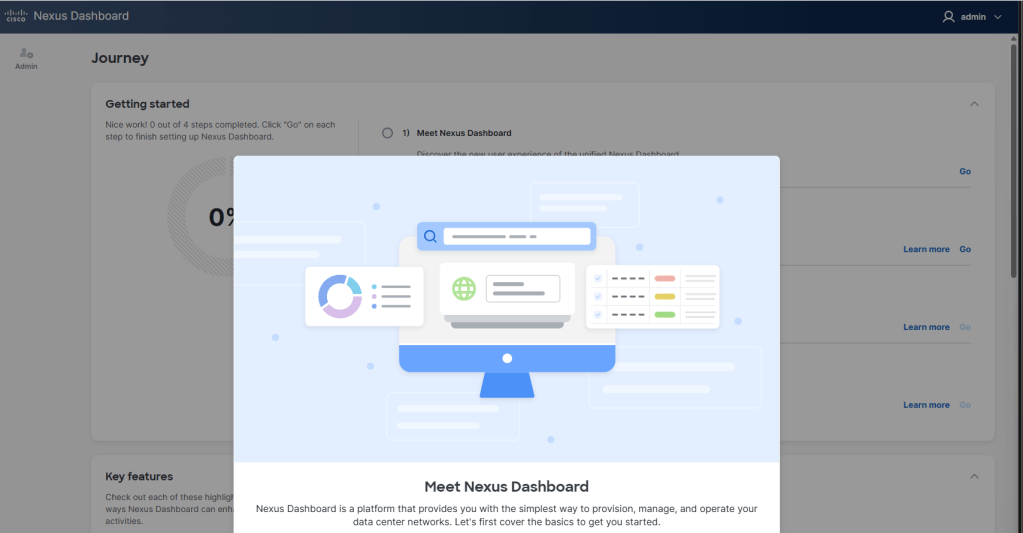
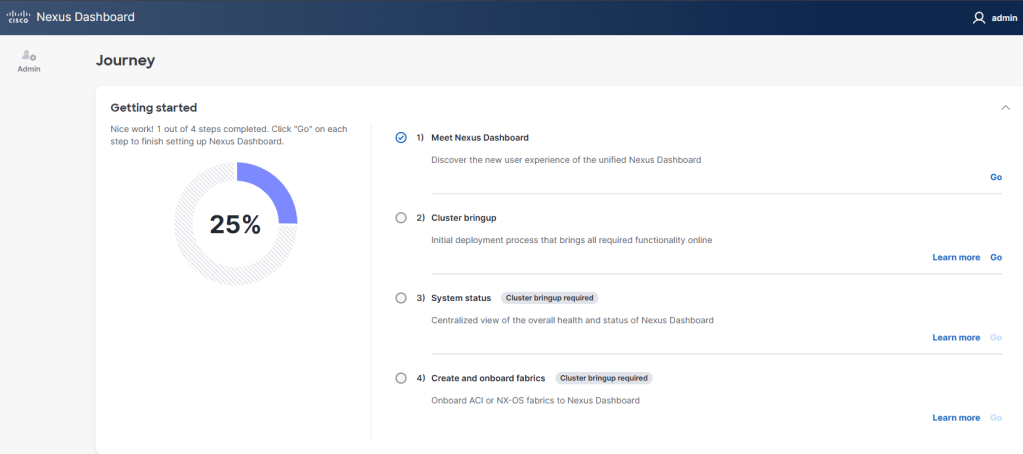
As usual with our version 4 Nexus Dashboard deployments we have the ‘Getting Started’ setup assistance. I’ll be selecting each section for configuration to ensure our percentage is 100% before proceeding.
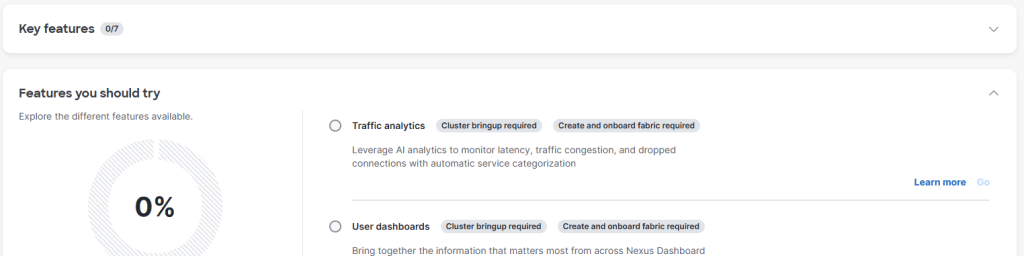
In version 4.3.1 there is some additional guidance on this page below ‘Getting Started’, there are guides on ‘Key Features’ such as fabric overview and connectivity. I’ll be skipping over these sections for now and concentrating on deploying my Nexus Dashboard.
Initial Nexus Dashboard Deployment (Cluster Bringup)
The main portion of ‘Getting Started’ is section 2) Cluster Bringup. This is where we’ll specify our low level information. Select GO

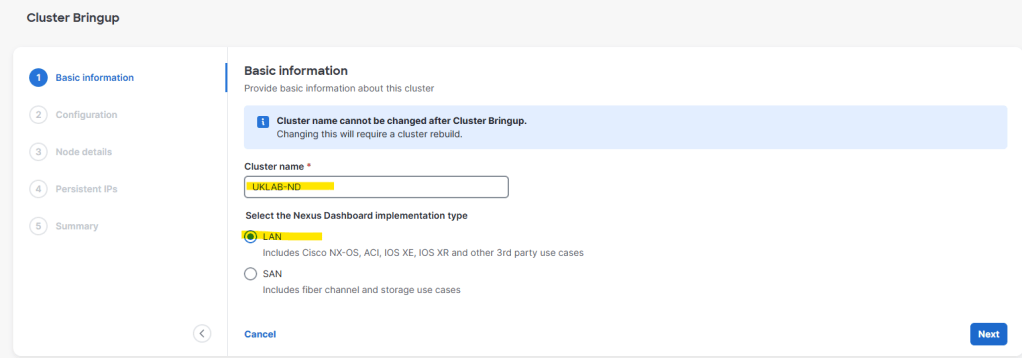
Here we’re requested to input our basic information which includes our cluster name and implementation type. We’re deploying LAN because our focus is VXLAN EVPN fabrics.
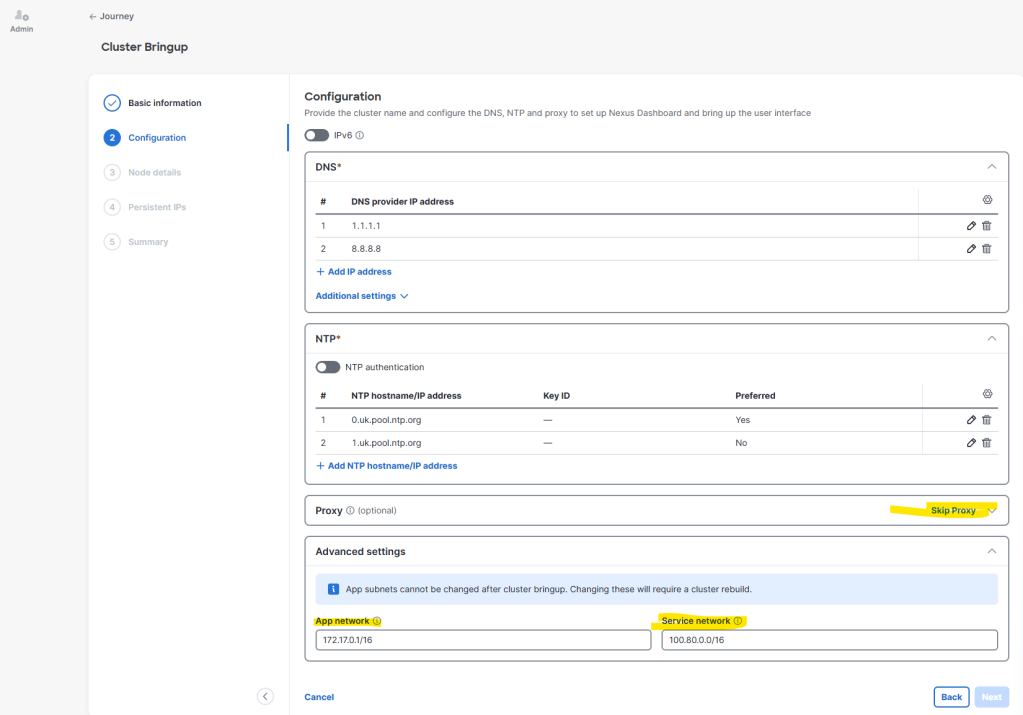
Next we’re onto configuration. Here we’ll be asked to input our DNS and NTP and set our App and Service network. If you’re familiar with Kubernetes then you’ll be aware of Pod and Service networks. These map directly to our App and Service networks.
In my network I am inputting external DNS servers and NTP as I currently have no internal DNS or NTP services running. As for the App and Service networks i’ll be leaving this as default. *Don’t forget to select ‘Skip Proxy’ if you’re not using a proxy or you will not be allowed to continue.
Next, our node details. In a production cluster with a minimum of three nodes this is a very very important section to get right. We must be clear on whether our nodes are connected on the same layer-2 at the fabric0 interface or layer-3 connected (BGP).
Again if you’re familiar with Kubernetes you’ll be aware of the deployments types and the VXLAN tunnels deployed between nodes over the layer-2 connected interface (Fabric0).
If you’re using physical nodes connected to catalyst switches be aware of vlan constraints here *Read the whitepaper.
The only time i’ve seen a requirement to use BGP here is AWS deployments as VPC have unique subnets.
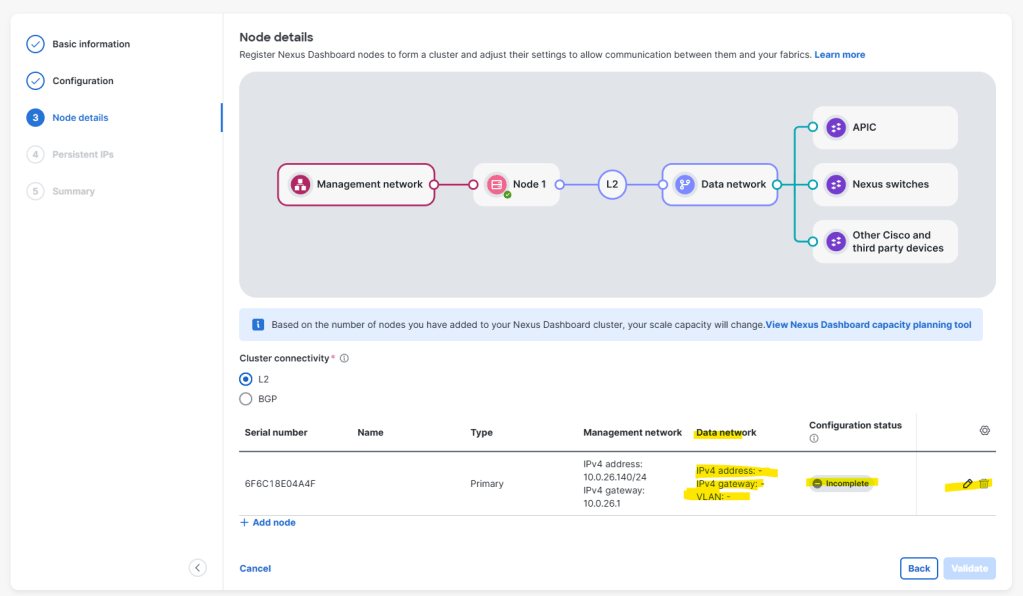
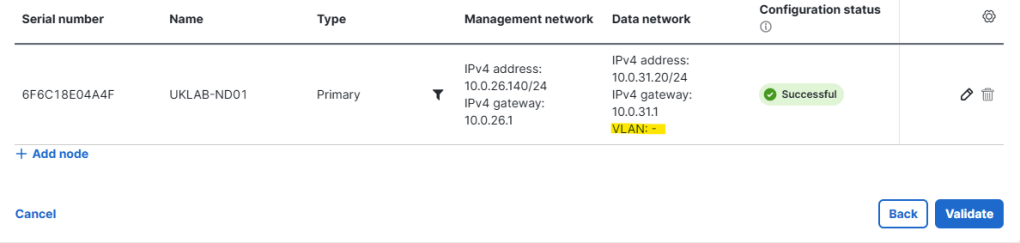
This is the prepopulated screen. However, we can see we have not yet configured the Data network (fabric0). Select the pencil and configure the fabric0 interface addressing, VLAN and name. In my network the dashboard is connected to access VLANs so there is no requirement to set a VLAN at this time.
Once configured we can see ‘Configuration status’ as Successful. Next we’ll validate before proceeding to assign our persistent IP addresses.
Our persistent IP addresses are used for services within the Nexus Dashboard, for example Telemetry collector and the SNMP & Syslog receiver and the Switch Bootstrap Server. If you move to using the Endpoint Locator in future you can add more persistent IP addresses for additional services such as this on either mgmt0 or fabric0.
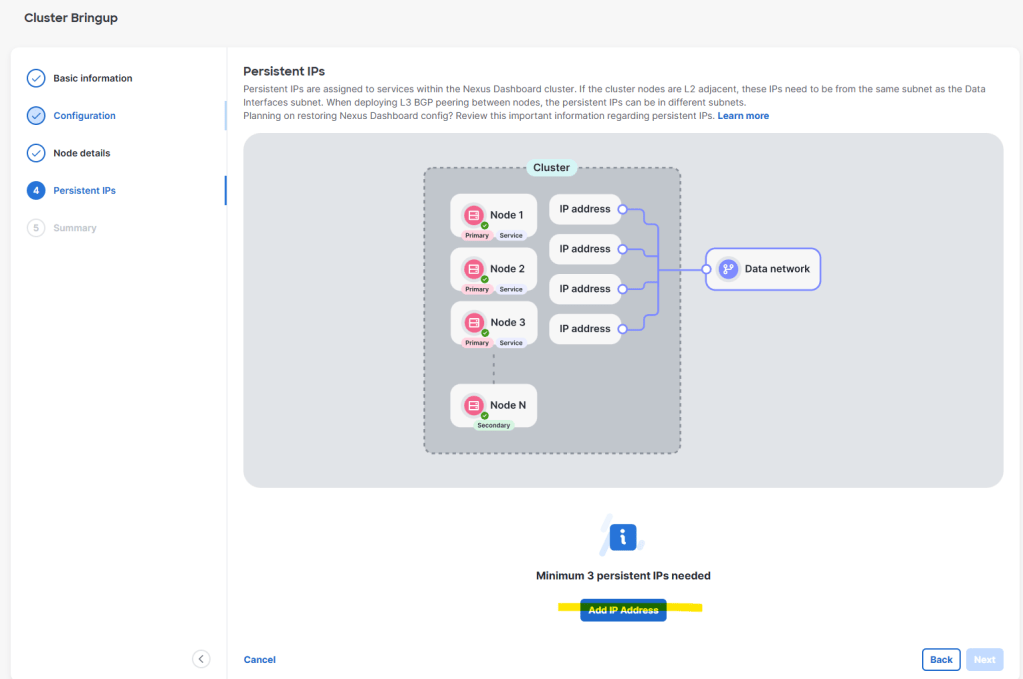
There is a minimum requirement for 3 persistent IP addresses however I am adding 10 just so I don’t need to worry about it in future for additional services. Note the persistent IPs im currently adding are on the data network (fabric0). As we’re carrying out a layer-2 deployment our persistent IPs must be in the same subnet as the connected interface. In our case 10.0.31.0/24
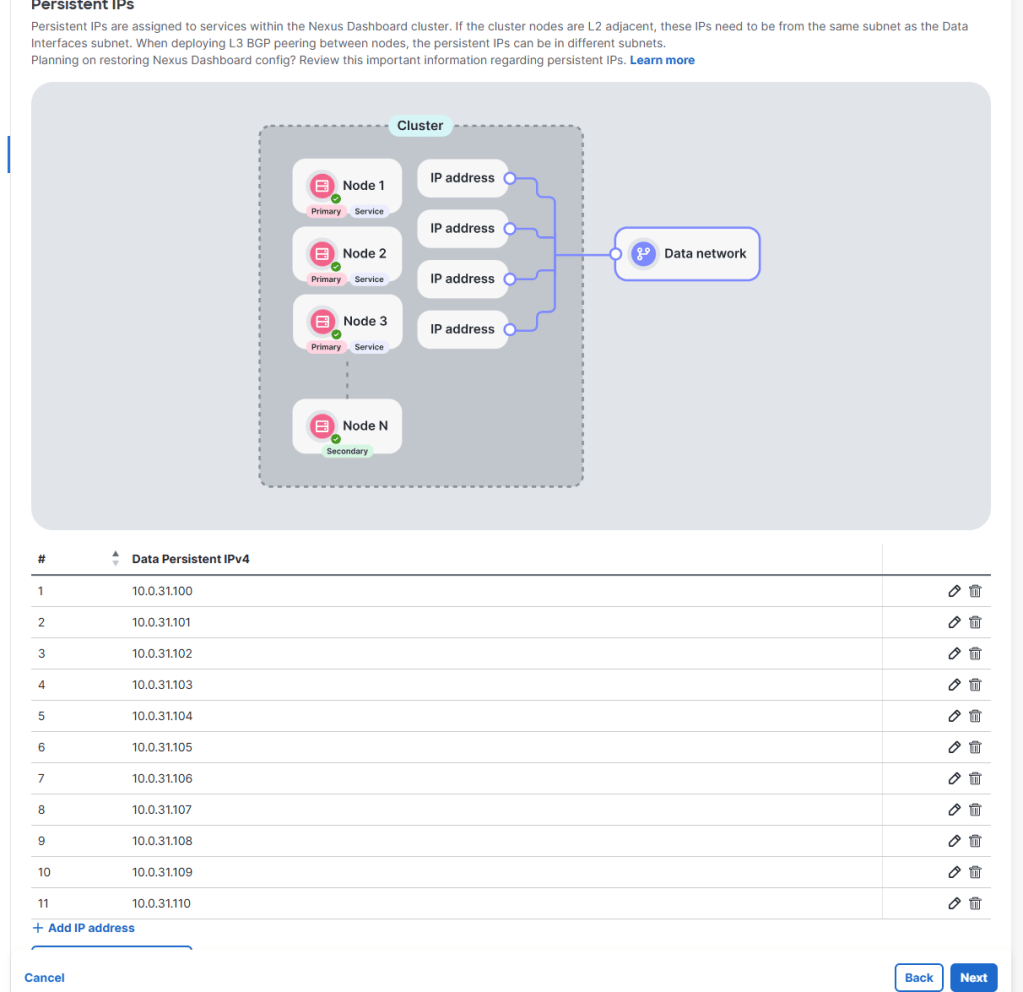
After we assign our persistent IPs and select next we’ll then be provided with a summary of all the configuration we have input into the wizard. I always take a copy ofthis in case of any issues during the deployment. Select save and we will continue to bring up our node.
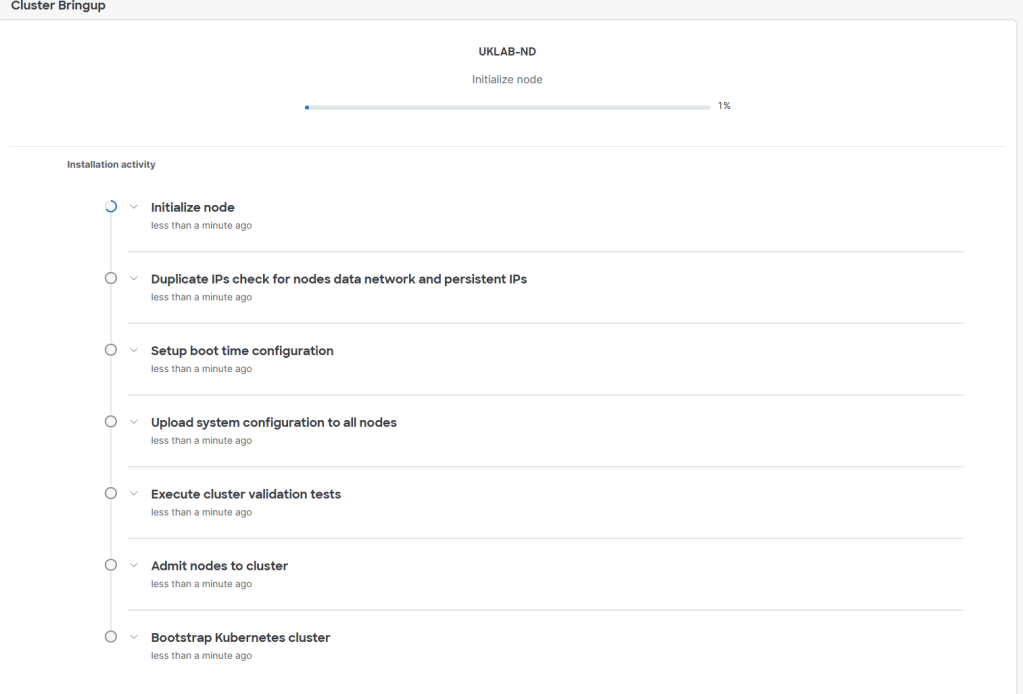
I typically see failures here either with DNS and NTP validation or incorrect addressing and no layer-2 between nodes. *Often we have not correctly reviewed the whitepaper when connecting Nexus Dashboard UCS nodes to catalyst switches.
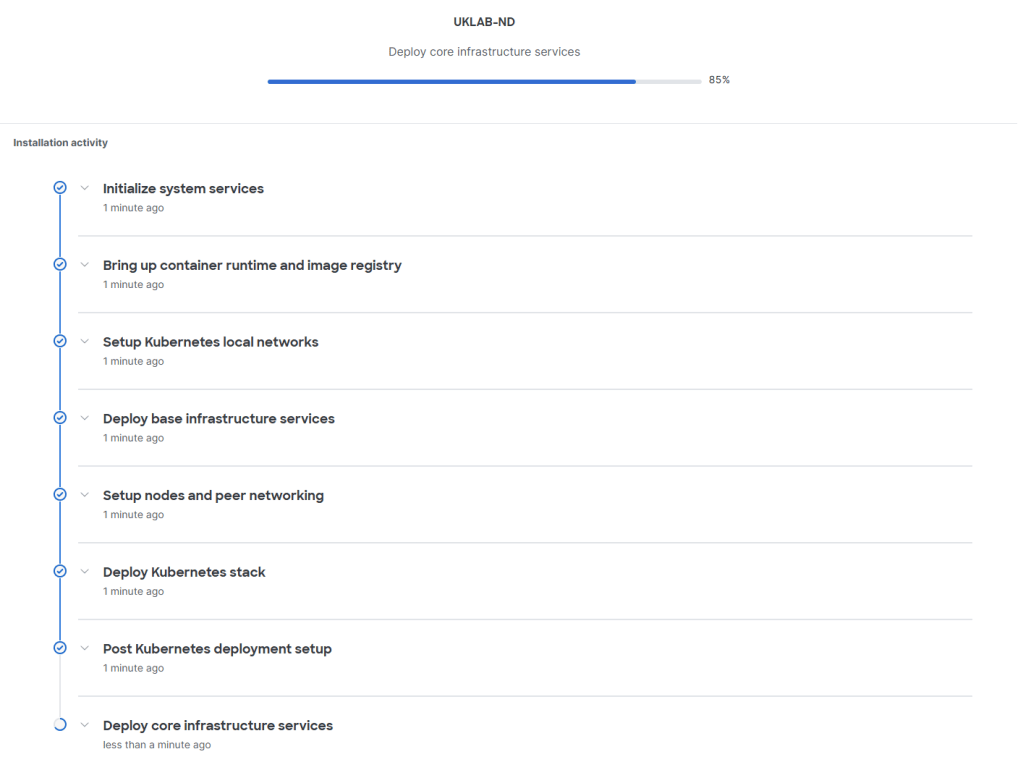
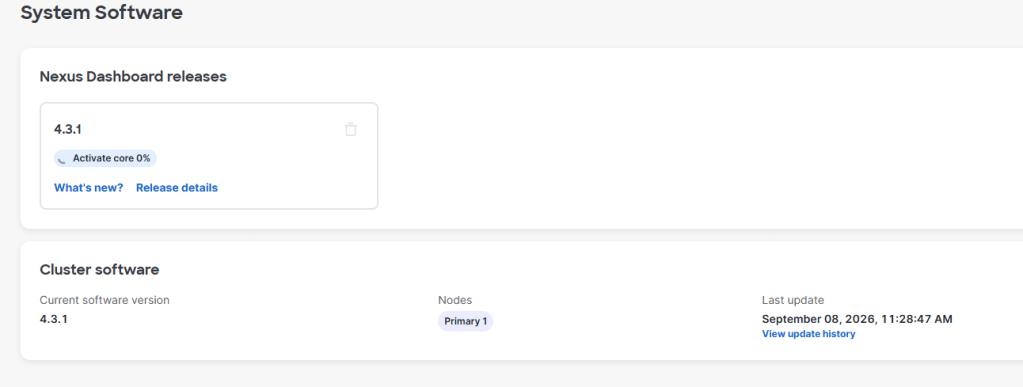
Once installation is completed we’re automatically directed to the system software page where the node activation begins. Time for another coffee.
The activation is now completed and additional tabs appear on the left hand side along with ‘Running’
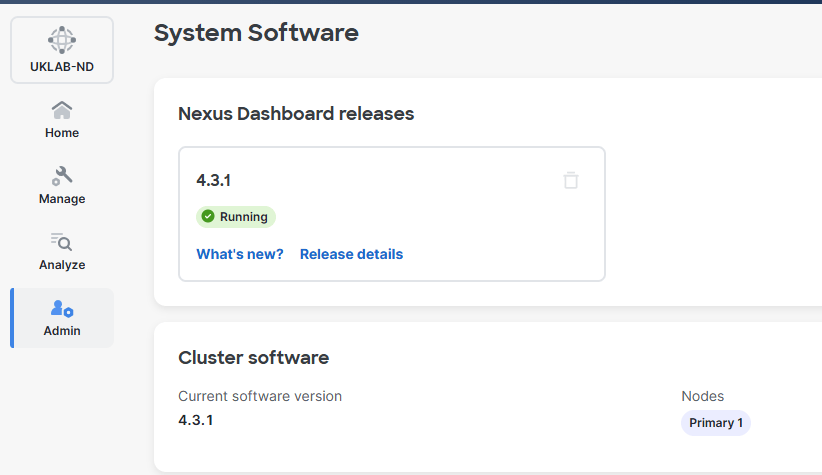
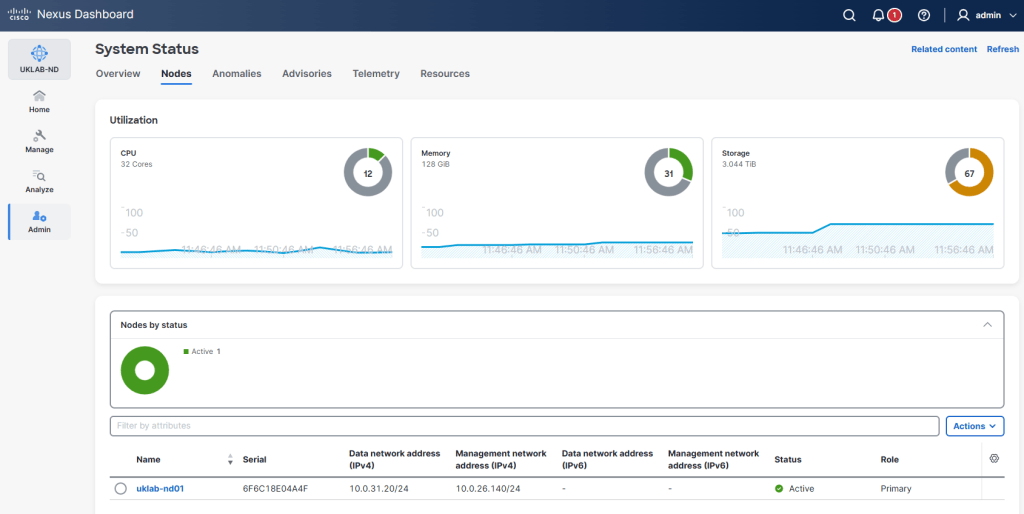
And there we have it, Nexus Dashboard 4.3.1 deployment is completed. Next i’ll be posting intersight connectivity and Cloud Control along with some fabric deployments using CML.
 Internet Plumbing