
Since my last page where I integrated my 4.3(1) Nexus Dashboard into Cloud Control via Intersight I had to hit pause to find out why I was unable to use the AI Assistance and generate widgets within AI Canvas.
The issue was caused by permissions and I believe this is now resolved, I will demonstrate below how to apply the correct permissions for products in Cloud Control.
To add I have since created a new VPC BGW Multi-Site fabric within my Nexus Dashboard, I have deployed some new networks and confirmed endpoint connectivity. I won’t go into the fabric deployments in Nexus Dashboard here, I will leave that for another series of posts. Today we’re here to look at Cloud Control and the main reason this looks like such an incredible cross domain AI OPs product.
Cloud Control
I have logged into my Cloud Control portal HERE.
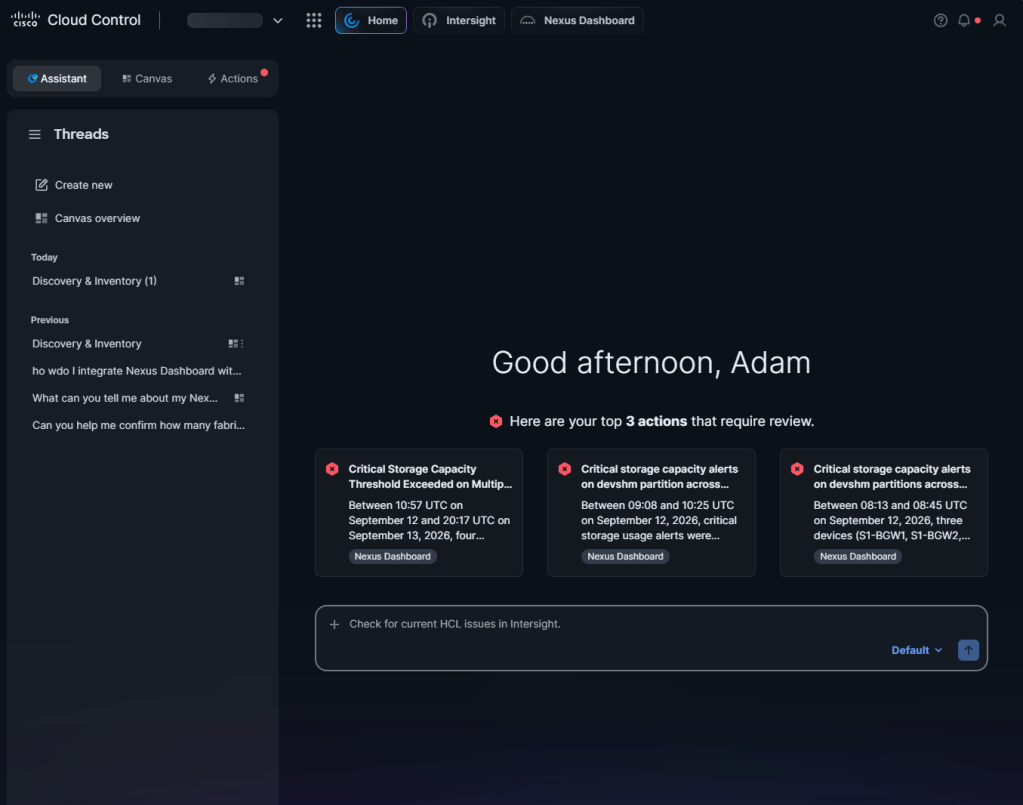
This takes me to my home page where we can now see lots of alerts after our integration into Cloud Control for our Nexus Dashboard. This is great news, the Cloud Control portal is identifying these issues, however at this time I do not have permissions to type any prompts into the AI chat.
(You can see on the left some of my previous prompt attempts, “ho wdo I integrate Nexus Dashboard with Cloud Control” is a great one).
The Nexus Dashboard Fabric (Within Cloud Control)
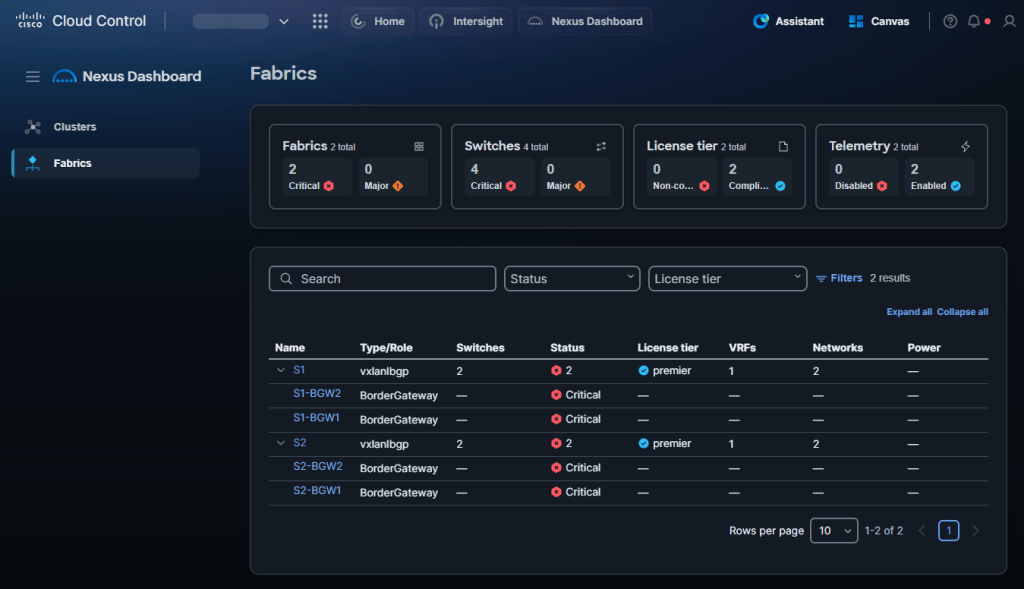
It’s worth side stepping and showing the fabric deployed in Nexus Dashboard. These are the fabrics being picked up with issues above. If you look at the alert on the far right we see S1-BGW1, S1-BGW2… This is referencing the VPC BGW fabrics shown below.
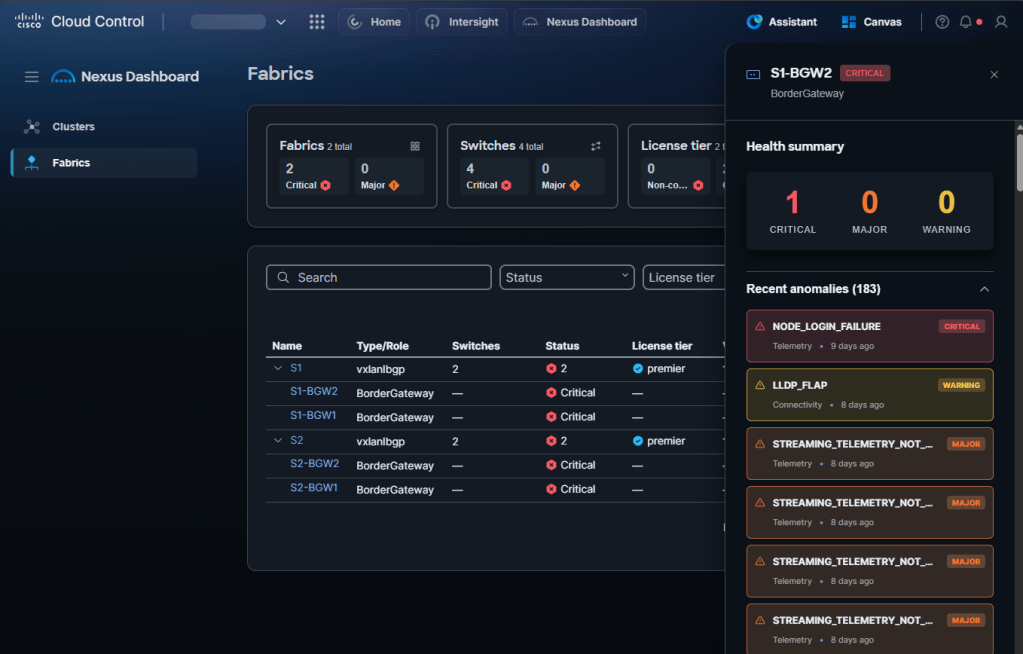
If we select one of the devices the Telemetry configuration i’m yet to complete is on show. This is why we are seeing anomalies.
Cloud Control AI Assistant Testing
Now we can get back to our AI Assistant testing. The prompt below returns errors and gives me a handy pointer on how to resolve the issue.
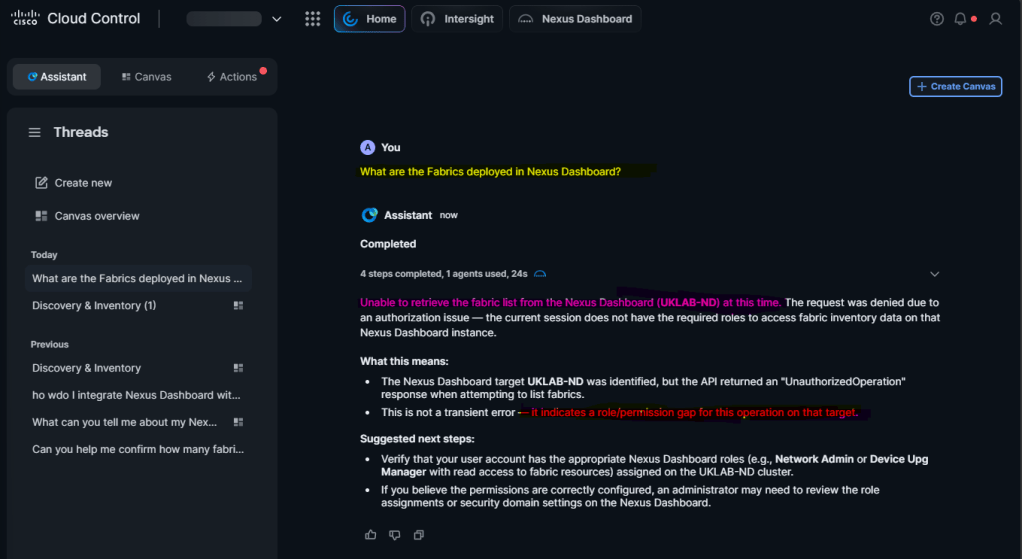
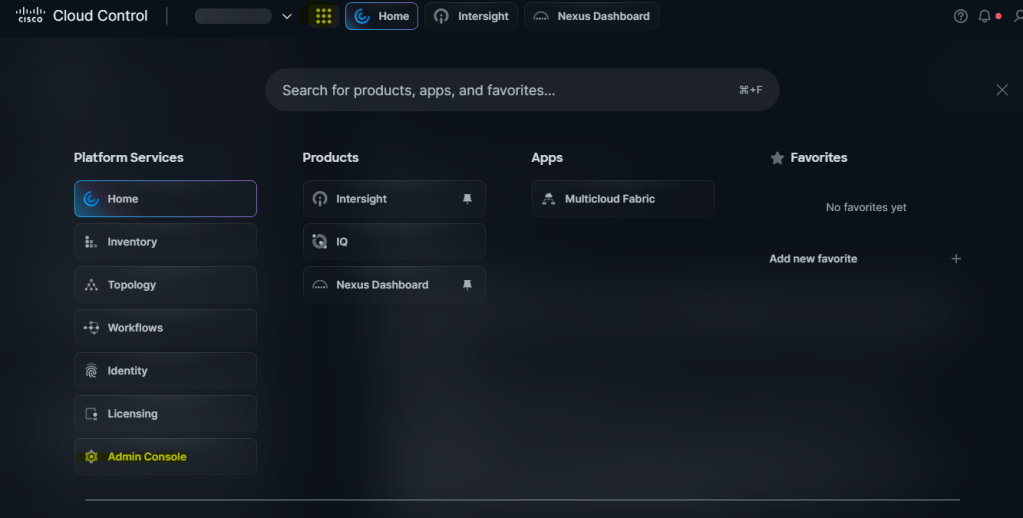
To resolve permissions for our connected products we select the nine dots on the top bar followed by admin console.
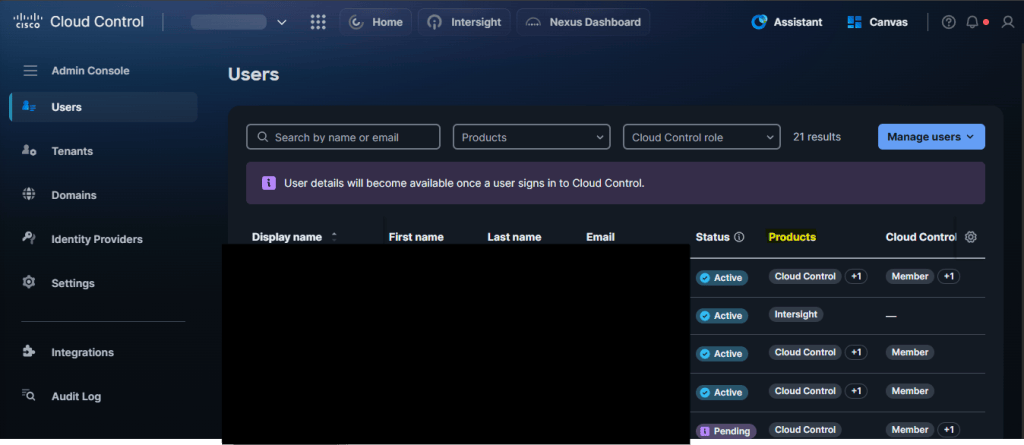
Now we’re faced with the list of users that have access to Cloud Control and specifically which products they can access on the right. My user currently has access to Cloud Control and Intersight. I need to add Nexus Dashboard to that list.
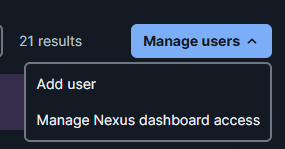
I select ‘Manage Users’ on the right which gives the handy option of ‘Manage Nexus Dashboard Access’.
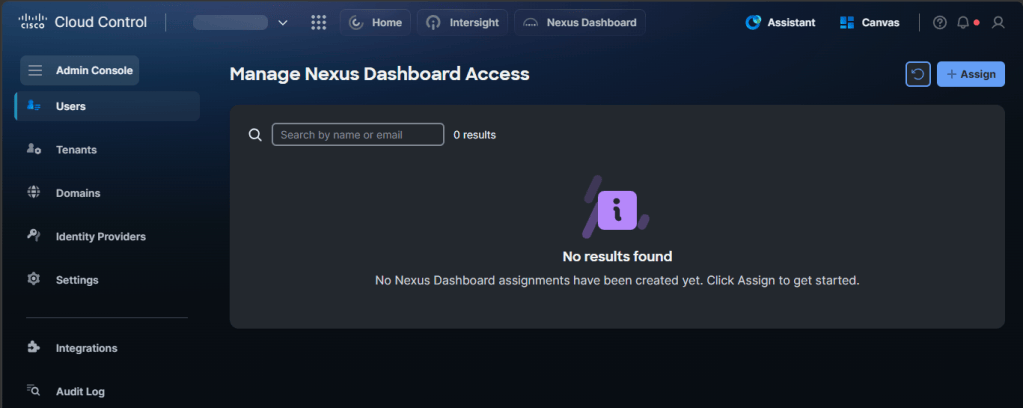
Initially as you can see below we have no users managing Nexus Dashboard. We can ‘+Assign’ and add users that require Nexus Dashboard access.
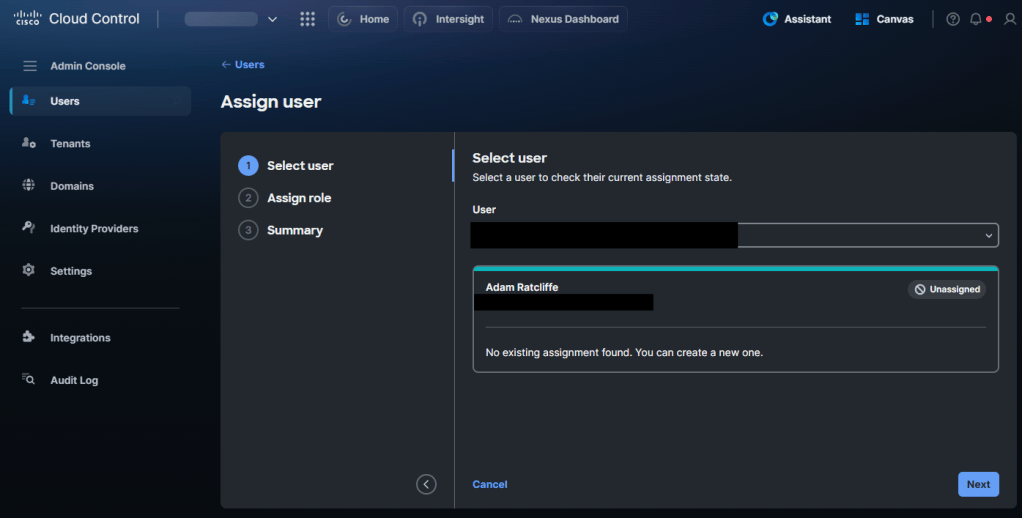
Once the user is selected we’re then requested to assign the user role. This directly maps to the Cisco Nexus roles. You have to specify a reason before you can select Next and proceed.
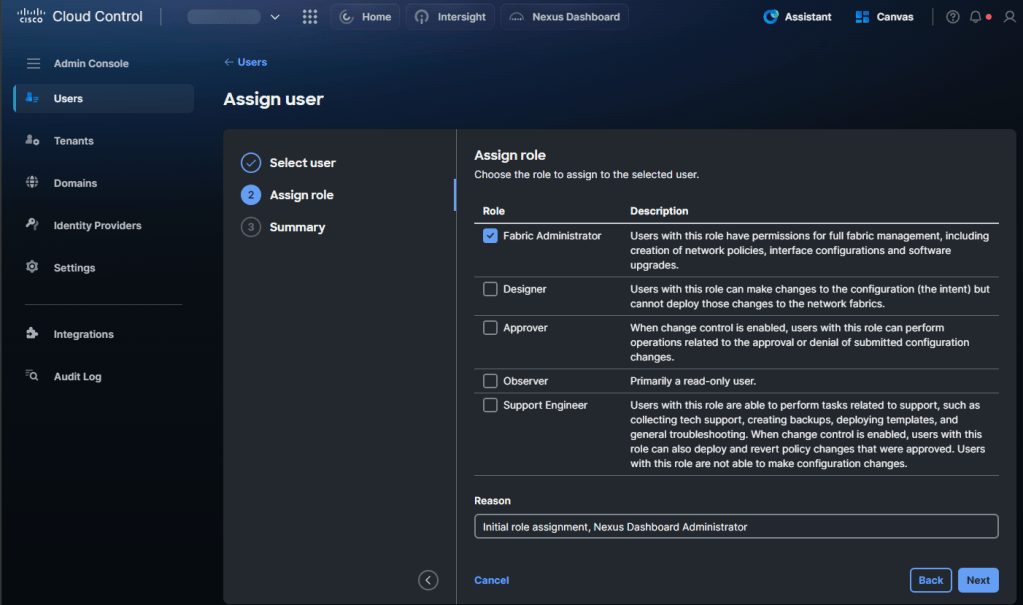
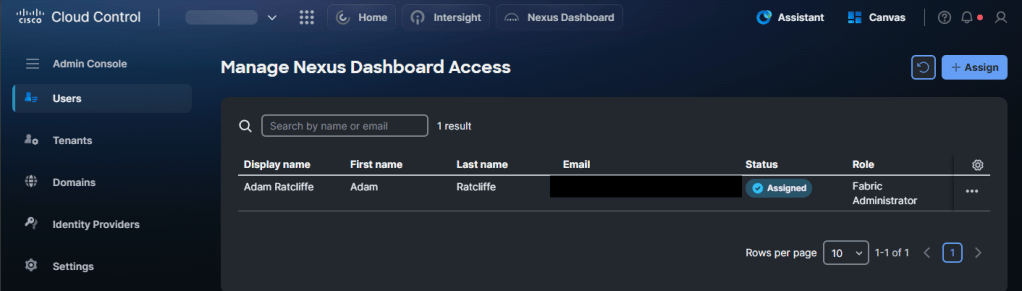
Summary allows us to review our selections and save. We can now see my account is added to the ‘Manage Nexus Dashboard Access’ section under ‘Users’.
I will now return to the home page and test my prompt again….. Amazing, it works! ‘What are the Fabrics deployed in Nexus Dashboard?’
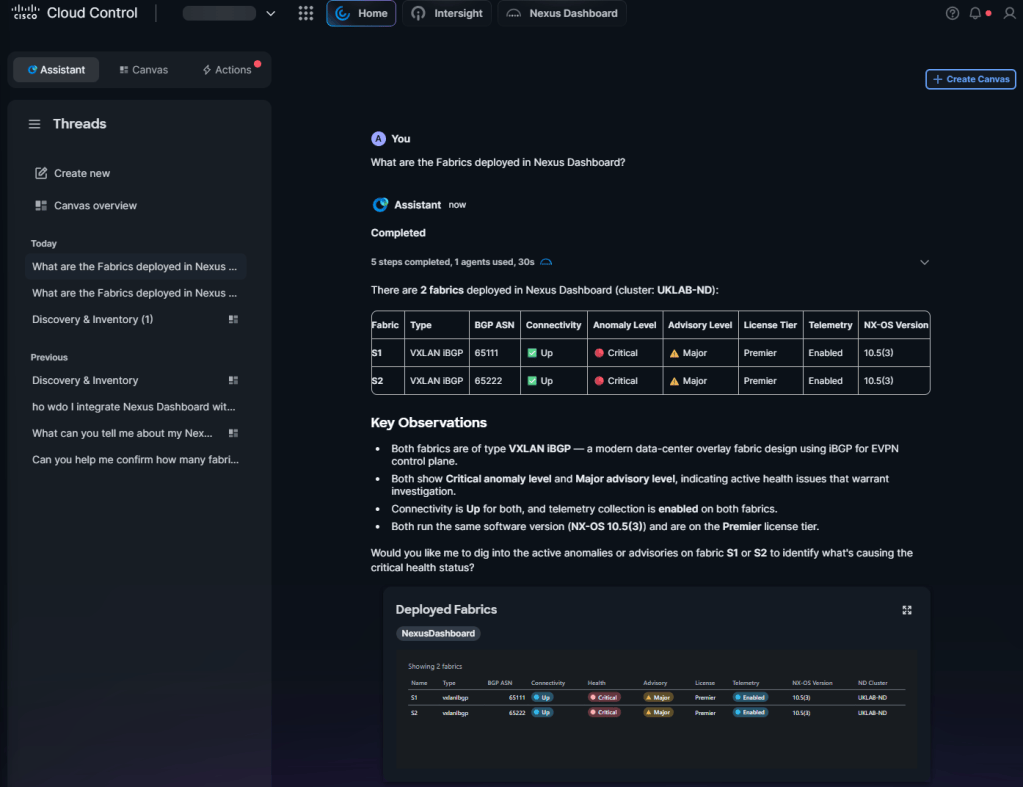
Next i’ll try opening this response within canvas by selecting ‘+canvas’ in the top right. Canvas has opened and I can add my deployed fabrics to it.
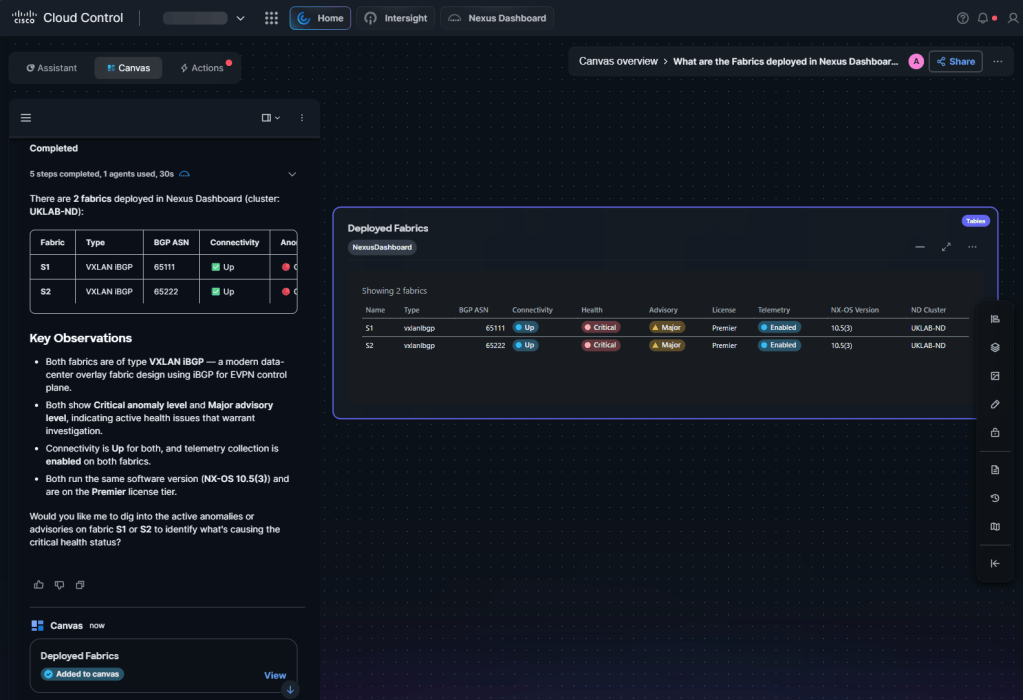
My next prompt within canvas: ‘Can you tell me why my fabric health is critical?’ The active anomolies widget is then deployed automatically to my canvas.
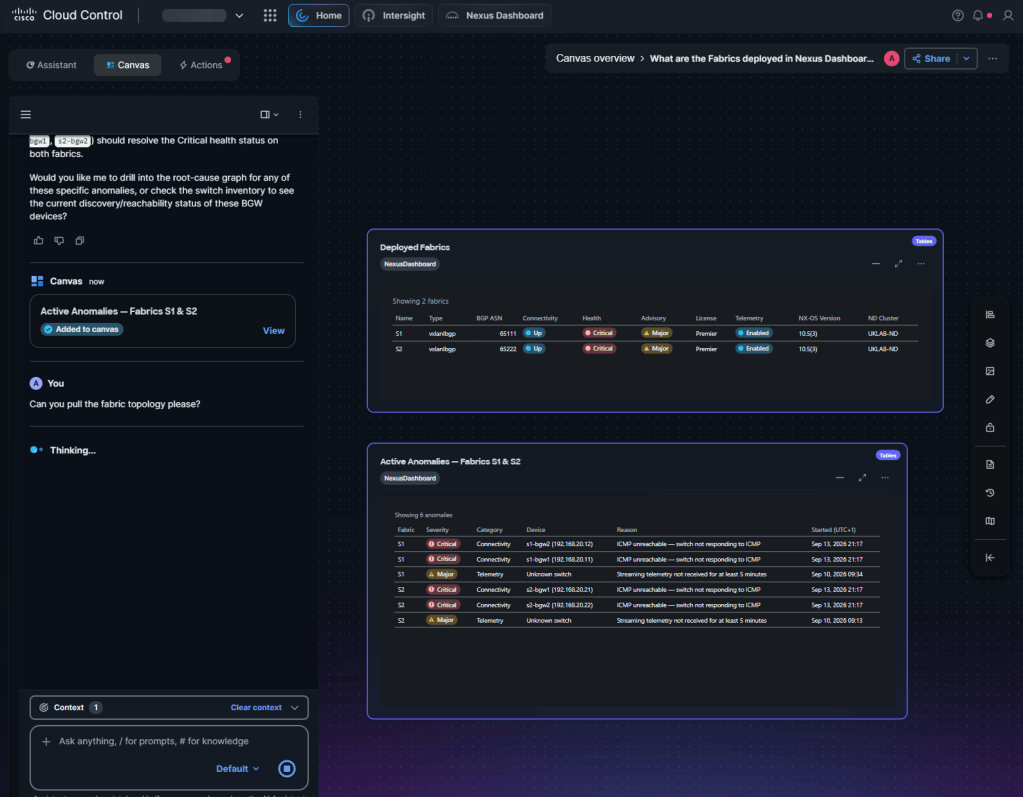
I’ve then followed this up with the prompt: ‘Can you pull the fabric topology please’. This prompt has added the switch inventory, which does give us more information on fabric health state however it’s not what I asked for.
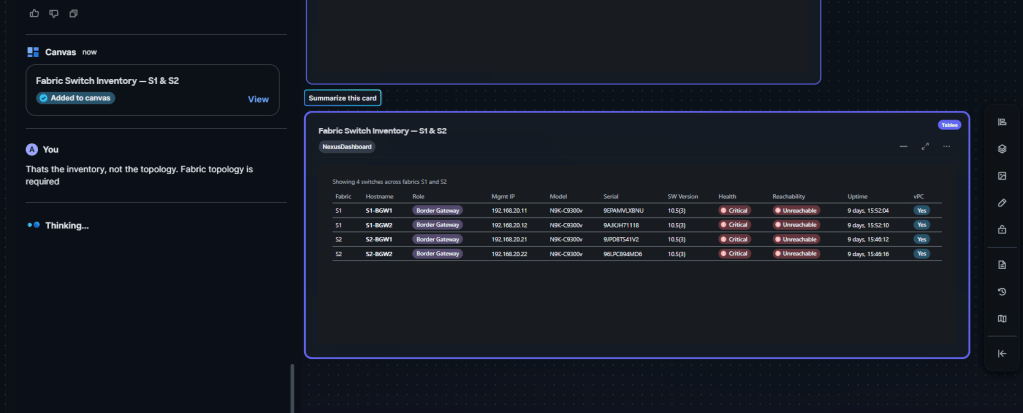
The next prompt: ‘That’s the inventory, not the topology. Fabric topology is required’. This was followed up by the following ‘Capability Gap’. This looks to be doing a more advanced lookup on state and requires confirmation before it will proceed.
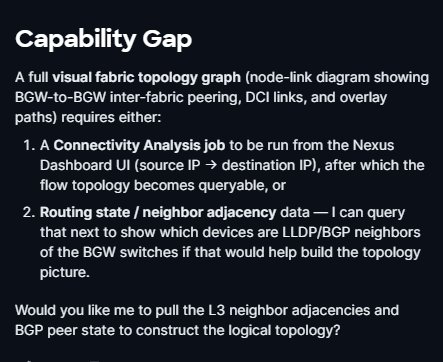
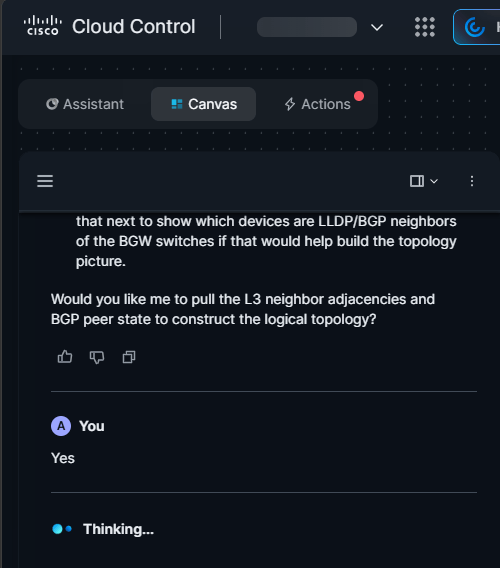
I have responded ‘Yes‘ to the L3 neighbor adjacency and BGP peer state question. I imagine this will take a bit longer, all responses have been very quick so far.
A pause point for sure, this prompt is taking some time. To be continued….. ‘Thinking…’
 Internet Plumbing